
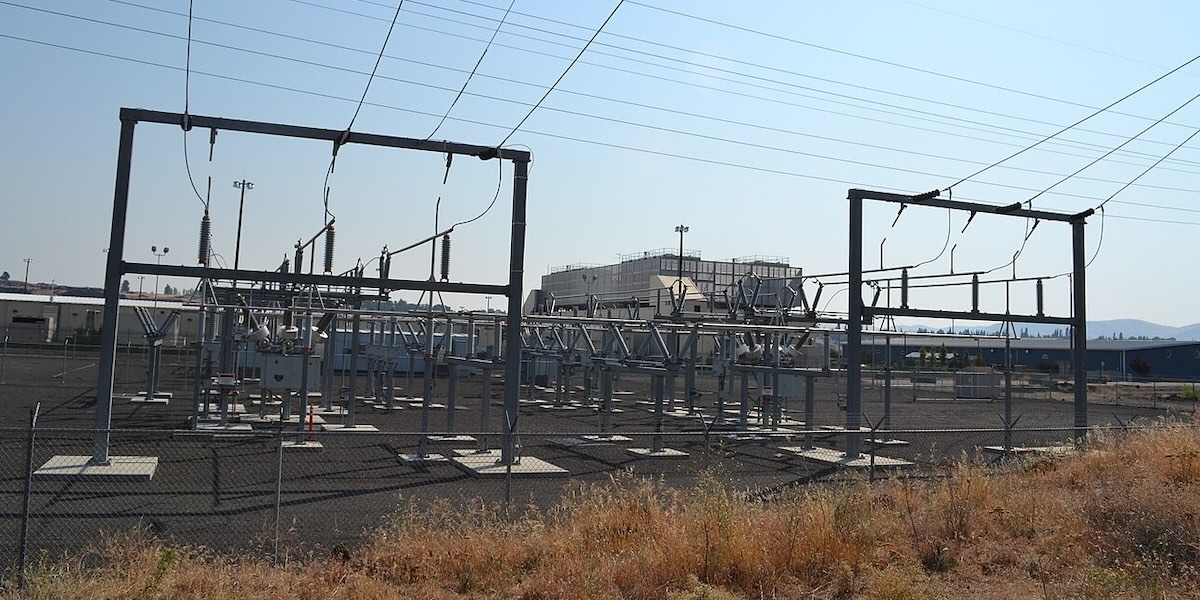
En la imagen
A Google data center in the US [Wikipedia]
Introduction
In the current debate on artificial intelligence, the management and use of natural resources has acquired considerable importance, not only because of the quantities consumed, but because of their effects on the communities that live near this infrastructure and on the environment. The sources analysed for this essay reflect a complex reality in the field of energy and water, in which genuine technical progress coexists with structural deficiencies that affect electricity grids, river basins and those same communities. All of this reveals, with increasing clarity, the capacity or incapacity of states and regions to govern artificial intelligence, a technology whose expansion appears difficult to reverse. This essay reads it as part of a transformation comparable to the Industrial Revolution, because it is reshaping how energy, water and land are allocated between states, companies and communities.[1] The comparison is not only rhetorical. The first industrial revolution was also, in this reading, a story of coal and rivers, and its costs were felt first in the towns that hosted the mills.
The electricity consumption of artificial intelligence is one of the central questions of this study. Although it is true that artificial intelligence represents a small share of world electricity consumption, the reports consulted warn of tensions that compromise the capacity of public authorities to set the terms of its deployment, and these tensions call for structural decisions that will be analysed below. Data centres consumed about 1.5 per cent of the world’s electricity in 2024, according to the International Energy Agency.[2] In 2025 they consumed 23 per cent of Ireland’s metered electricity, according to the Irish Central Statistics Office and press reporting of its data.[3] Although it may seem contradictory, both figures are correct. This essay breaks down that apparent contradiction, because the choice between the two figures determines almost everything that follows.
As regards the structure of the article, it first examines the general situation of energy consumption and its measurement. It then turns to the specific challenges in the areas of electricity and grid capacity, water and territory, and the models of access that different states have adopted. Finally, it proposes the conditions a country should secure in order to be strategic in this field and not fall behind, which, as will be argued, does not mean hosting the most capacity.
Before starting, a methodological warning is in order. The analysis is documentary. It draws on official statistics, reports by international agencies, company disclosures, court and regulatory decisions and specialised press, with data from 2023 to 2026, all consulted in October 2026. Since these sources combine measured data, modelled estimates and self-reporting, the notes indicate in each case which is involved, and say so when a figure rests on a single secondary source.
General situation of consumption and its measurement
The global figures can, in principle, be considered reliable, but at the same time they are subject to an important problem of framing, which is visible in the public debate on the consumption of natural resources. The IEA estimates that data centres used 415 TWh in 2024 and 485 TWh in 2025, an increase of 17 per cent, and projects some 950 TWh by 2030, roughly 3 per cent of world demand.[4] Against this, electric motor systems accounted for 53 per cent of world electricity consumption in 2023, some 13,462 TWh, and space cooling for about 10 per cent according to an IEA assessment of 2018.[5] Data centres also explain less than a tenth of the growth in world electricity demand to 2030.
Artificial intelligence in the strict sense is a smaller fraction still, although the definition used determines the result. Gartner places AI-optimised servers at 95 TWh in 2025, 21 per cent of its estimate of 447 TWh for data centres as a whole, which represents roughly 0.3 per cent of world demand.[6] In terms of individual use the figures are very small, since Google reports a median of 0.24 Wh for a text prompt and Epoch AI estimates about 0.3 Wh.[7]
These per-query figures, however, tend to circulate in the public debate as though they described the total cost of artificial intelligence, and read in that way they mislead. The figure published by Google covers a median text prompt and expressly leaves the measurement of training to future work, while the figure that the chief executive of OpenAI gave for ChatGPT in 2025 was offered in a blog post without a published method.[8]Mistral AI is, among the sources reviewed, the only provider that publishes a lifecycle analysis including training.[9] Table 1 sets out what each disclosure covers and what it leaves out. The consumption of artificial intelligence does not therefore originate in simple conversational use, but in training, in heavy inference such as reasoning, images and video, and in the sheer volume of deployment.

The perception of the problem presents contrasts, and two widely repeated comparisons do not survive the sources consulted. Electric vehicles, often said to consume more, used about 250 TWh in 2025, roughly half as much as data centres.[10] Comparisons with steel, cement, aviation or streaming usually arrive without a primary source and set activities that run largely on fuels against electricity alone, so this article does not employ them.
Taken together, the sources consulted allow it to be inferred that the principal problem of the current debate is not the absence of figures, but the choice of the unit in which those figures are expressed. The familiar argument compares stocks when the discussion concerns flows and places. A use that represents 1.5 per cent of the total but grows 17 per cent a year, while facilities focused on artificial intelligence grew about 50 per cent in 2025, weighs considerably more at the margin than on average, given that total demand grows about 3 per cent.[11] In the United States, data centres account for around half of the expected increase in demand to 2030, and in advanced economies for more than a fifth.[12] Nor does efficiency settle the matter. Google reports a thirty-three-fold reduction in energy per prompt in a single year, yet its total electricity consumption rose 37 per cent in 2025.[13] This is the dynamic that the specialised literature describes as a rebound effect, although the available evidence does not permit its magnitude to be measured.[14]
This diagnosis becomes especially visible in the specific areas examined in the next section.
Analysis of specific areas
i. Electricity and grid: the distance between the world average and the local share
In terms of territorial distribution, the weight of data-centre electricity consumption varies by a factor of fifteen or more depending on the scale observed. Figure 1 shows the local shares that the sources support, together with the kind of figure each one represents, since mixing metered consumption with requested capacity is a frequent error in this debate.
Ireland constitutes a striking extreme case. Data centres rose from 5 per cent of metered electricity in 2015 to 22 per cent in 2024, a period in which total metered consumption grew 30 per cent and theirs grew 462 per cent, and in 2024 they exceeded urban households, at 18 per cent, and rural households, at 10 per cent, taken separately.[15] In 2025 they consumed 7,663 GWh while domestic consumption rose only 1 per cent. In Virginia the share exceeded a quarter in 2023, and commercial demand moved from annual growth of 1.4 per cent between 2009 and 2019 to 5.8 per cent between 2019 and 2023.[16] In Frankfurt the sources range between 20 and 40 per cent, probably because they measure different perimeters or years, so no single share should be cited.[17]

Aragon is revealing for a different reason. It is an autonomous community of Spain that is, to a large extent, a demographic desert, since some 85 per cent of its territory has fewer than 12.5 inhabitants per square kilometre.[18] There, data centres stood at roughly 14 per cent in 2025 according to a press calculation, with some 108 MW of computing capacity installed.[19] An empty territory is attractive to this industry precisely because land is available, but its grid was not built for loads of this size.
The question of who pays for this expansion further complicates the debate. The independent market monitor of PJM, which is the largest electricity market in the United States, attributes 45 per cent of 47.2 billion dollars in capacity costs across three auctions to data-centre load forecasts.[20] By contrast, an analysis by the Lawrence Berkeley National Laboratory, cited by the Congressional Research Service, concludes that grid investment, and not data centres, was the main driver of retail price increases between 2019 and 2025.[21]Since the discrepancy concerns attribution and not measurement, both readings deserve to be presented.
To preserve the objectivity and clarity of this analysis, it is also necessary to warn of the risk of treating announcements as consumption. The 233 GW of large-load requests recorded in Texas in March 2026 represent “requested capacity”, a category that includes applications which specialists of the University of Texas and the Regulatory Assistance Project describe as not all real.[22] The same caution applies to the 38 GW of access requests reported in Brazil and to the figures granted in Spain. The latter are examined below.
ii. Water and territory: the national average conceals the river basin
The treatment of water in this debate has evolved from a stage of near-invisibility towards a framework of litigation and local refusal, although measurement remains deficient. The most reliable direct figure is modelled rather than measured, since the Lawrence Berkeley National Laboratory estimates about 17.1 billion gallons, some 65 million cubic metres, of on-site consumption by data centres in the United States in 2023, while acknowledging that few direct measurements exist.[23] Indirect water, consumed by the power stations that supply the electricity, alters the order of magnitude, and the team led by Shaolei Ren projects a global withdrawal for artificial intelligence of between 4.2 and 6.6 billion cubic metres in 2027, a projection resting on assumptions and not a measurement.[24] These figures cannot be placed on a single scale or drawn as a trend, because each one measures something different. Table 2 shows why.
Despite the predominance of reassuring comparisons, the most frequently cited of them, the one between data centres and golf courses, does not withstand examination. It mixes direct and indirect water, sets consumption against withdrawal, and overlooks the fact that a golf course is situated in a basin shared by its own users, whereas a data centre may export services from a stressed basin to a much wider base of users, often located far away.[25] The national figure conceals the basin, which is precisely where the conflict occurs.

Documented cases illustrate the mechanism. In February 2024 a Chilean environmental court partially annulled the permit for Google’s data centre at Cerrillos, in Santiago, and required the assessment of the aquifer to incorporate the effects of climate change after some fifteen years of drought, after which the company redesigned the facility to use air cooling.[26] In August 2025 the city council of Tucson, in Arizona, unanimously rejected Project Blue, a development linked to Amazon, amid disputes over the confidentiality agreements that had surrounded the negotiation.[27] In March 2026 a Spanish regional high court admitted the first administrative appeal against a plan of Amazon Web Services in Aragon, with pleadings that cited opacity over water use.[28] In Georgia, finally, four families sued Meta in September 2026 over alleged damage to an aquifer and contamination of wells, allegations which the company disputes and which remain unproven.[29]
In the case resolved most clearly, that of Cerrillos, the dispute with one of the Big Tech companies ended in redesign rather than outright cancellation, and that outcome has an effect that deserves to be made explicit. A common remedy for reducing water use is air cooling. However, air cooling simply shifts the burden towards the electricity grid, because it requires more power, so the water problem is transferred rather than resolved. The conclusion is that water and electricity cannot be treated as separate policy files.
Not every conflict over this infrastructure concerns water, however. The Irish dispute is a matter of grid capacity, and Meta’s project at Zeewolde, in the Netherlands, was halted over renewable energy and land use.[30] Presenting them as water cases would weaken the argument rather than reinforce it.
The Gulf displays the structural version of the same tension. Rainfall there is below 100 millimetres a year and desalination supplies between 60 and 90 per cent of water, powered mainly by natural gas, so cooling with water competes directly with a resource produced from fossil fuel.[31]
iii. Models of access: capital, saturated grid, regulated access and water-stressed periphery
The evidence consulted permits a provisional typology of four models to be outlined, which is proposed here as an analytical instrument and not as a classification that the sources themselves establish. Table 3 summarises them.
The first model is capital. It combines abundant capital and energy with borrowed chips, and corresponds to the Gulf. Stargate UAE plans a campus of 5 GW, with 200 MW expected to be in operation by the end of 2026, while Humain, in Saudi Arabia, aims for 1.9 GW in 2030 and 6.6 GW in 2034.[32] These are plans and not operating capacity. What this model offers is capital, land and state-directed energy, and what it lacks is water and advanced chips, since Washington was considering in May 2025 the export of large volumes of semiconductors to Saudi Arabia and the United Arab Emirates, restricted since the end of 2023, which makes deployment dependent on a foreign authorisation.[33] The lesson of this model is that capital can buy capacity, but not control over the inputs on which that capacity depends.
The second model is that of the saturated grid, exemplified by Ireland and Virginia, where the difficulty does not lie in generation but in the network itself. Dublin has operated under a de facto moratorium since 2021. Following that, in December 2025 the Irish regulator decided that large energy users must provide dispatchable generation or storage and obtain 80 per cent of their electricity from new renewable projects within six years.[34] In the United States regulation operates at state level, and Texas approved Senate Bill 6 in 2025 for loads of 75 MW or more, while Oregon created a separate tariff class for loads above 20 MW.[35]Virginia adds a fiscal dimension that the Irish case lacks. In Loudoun County, more than 40 per cent of tax receipts, some 1.2 billion dollars in fiscal year 2026, come from data centres, which leaves the county exposed if demand falls.[36] Local officials paused new approvals in September 2026 amid resident backlash, created a 120 million dollar revenue stability fund in 2024, and are drafting a requirement for operators to post decommissioning bonds.[37] The lesson to learn from this model is that a state may lose control of its grid, and of its budget, by consenting too rapidly.
The third model conditions access to the network, and is represented by Spain and the European Union in general. At Union level only transparency obligations are in force, namely the duty of operators of at least 500 kW to report annually under the Energy Efficiency Directive and the requirement of the Artificial Intelligence Act that providers of general-purpose models document energy consumption.[38] Spain, for its part, has a draft royal decree under consultation, and therefore not in force, applicable to facilities above 1 MW, which would condition grid access on at least 80 per cent renewable consumption, with additionality and hourly matching.[39] The Spanish case also reveals the distance between attraction and consumption, since more than 12 GW of access rights have reportedly been granted against a sector target of 2.5 GW of computing power by 2030, while Aragon has approximately 108 MW installed.[40] Here too the binding constraint is the network, given that only 141 of 542 interconnection nodes have agreed reference values.[41] The lesson of this model is that transparency informs the state, but does not yet bind the operator.
The fourth model corresponds to the water-stressed periphery, visible in Chile, Mexico and Brazil, where requested capacity is considerable, the installed base is small and water constitutes the principal point of conflict. Brazil reports 38 GW of access requests, which are applications and not consumption.[42] Mexico has about 279 MW in operation and at least thirty facilities in Querétaro, a state subject to severe water stress.[43]A Latin American investigation documents the absence of informed consent in Querétaro, in Canelones in Uruguay and in Patagonia.[44] Along with this, it should be borne in mind that the sources consulted do not provide the share of national electricity that data centres represent in any of these countries, so no comparison with the Irish figures can be established. The lesson of this model is that capacity can arrive in a region that never chose it, with the basin bearing the cost.
One limitation conditions the whole analysis. The open database of Epoch AI tracks ninety-three large facilities, but it is weighted towards the United States and covers an estimated 43 per cent of world capacity, which may not be enough to draw general conclusions.[45] Satellite imagery tracks construction but not consumption, and opacity at individual sites is established only indirectly, through disputes such as those in Aragon and Tucson.[46] Open sources therefore describe the United States adequately and the Gulf and the periphery poorly, an asymmetry that constitutes a finding in itself, since transparency is distributed as unevenly as the infrastructure.

iv. Conditions for a strategic country: from hosting capacity to setting terms
Whatever the pace at which artificial intelligence advances, the question for a state is no longer whether to host its infrastructure, but on what terms. A country is strategic in this field not because of the computing capacity it hosts, but because of the terms it is able to set. Five conditions follow from the cases examined, and they gather the lessons drawn above.
The first is firm electricity and a grid capable of carrying it. The IEA warns that around 20 per cent of planned projects could be delayed by grid bottlenecks, that transmission lines require between four and eight years of construction in advanced economies, and that lead times for transformers and cables have doubled in three years.[47] A commitment of gigawatts, consequently, is not a grid.
The second is water and territory, which requires an explicit rule on priority when a basin is short. Access to water is recognised as a human right, and General Comment 15 of the Committee on Economic, Social and Cultural Rights gives priority to personal and domestic uses.[48]
The third is access to advanced chips, which remains subject to export authorisation, as the specific case of the Gulf demonstrates. Emma Strubell and her co-authors warned in 2019 that the cost of cutting-edge computation excludes a large part of the research community, and the AI Now Institute maintains that computing capacity is highly concentrated, so that access to it operates as a form of power.[49] The dependence also begins before the data centre. Taiwan produces just under 90 per cent of the most sophisticated chips, and during the 2021 drought, the worst on the island since 1964, manufacturers such as TSMC had to bring in water by truck.[50] The water footprint of artificial intelligence therefore starts in a basin that is neither that of the data centre nor that of its users.
The fourth is rules and transparency, since reporting by site and by model constitutes the precondition for everything else. Europe has begun with reporting obligations, and Spain and Ireland have advanced further by linking access to additional clean generation. Some conditions are already law. Since the 2023 recast of the Energy Efficiency Directive, member states must ensure that data centres with a rated energy input above 1 MW use their waste heat, for instance in district heating, unless they show that this is not technically or economically feasible.[51] A rule of this kind turns a by-product into a benefit for the territory that hosts the facility. A state that cannot measure cannot negotiate.
The fifth is social legitimacy. Projects announced behind confidentiality agreements, as occurred in Tucson, encounter refusal. Participation should be understood here as an ethical requirement founded on subsidiarity, and not as a legal obligation currently in force, since no general legal standard of informed consent applies to this type of project.
The Spanish case, of which Aragon is the clearest example, illustrates why the fourth and fifth conditions are the most demanding. A state that grants twelve gigawatts of access against a plan for two and a half has attracted capacity without having chosen terms. A strategic country, by contrast, is one that can refuse, and that can consent on conditions it has stated in advance, such as the decommissioning bonds now being drafted in Loudoun County.
Conclusion
The energy and water consumption of artificial intelligence presents an evident duality. While it maintains a modest share of world electricity and a per-query cost that is genuinely small, it also generates deficits that affect electricity grids, river basins and the accountability of those who authorise this infrastructure.
The data reflect that the principal challenges derive not so much from the volume consumed as from the place, the pace and the visibility of that consumption. The figure that best summarises this analysis is not the 1.5 per cent of world electricity, but the distance between that figure and the 23 per cent of Ireland. Perceived opacity, the weakness of measurement by site, the use of requested capacity as though it were demand, and the difficulty of establishing who bears the cost of the network, all demonstrate the need to reinforce institutional controls before and not after the authorisation of each project.
Three moral references permit this diagnosis to be framed beyond the figures. Antiqua et Nova, the 2025 note of the Holy See on artificial intelligence, recalls that “‘the cloud’ is not an ethereal domain separate from the physical world” and that current models and their hardware “consume vast amounts of energy and water”, while warning of “the concentration of the power over mainstream AI applications in the hands of a few powerful companies”.[52] Laudato si’ supplies the vocabulary of water, stating that “access to safe drinkable water is a basic and universal human right”, and speaks of a true “ecological debt” between the global North and South.[53] Finally, Magnifica humanitas, the encyclical of Leo XIV on artificial intelligence, acknowledges that current systems “require enormous amounts of energy and water”, rejects a development that shifts “costs and burdens onto others”, and asks that local communities have a voice in decisions on data and digital environments, since “we cannot allow a handful of actors to dictate these processes on their own”.[54] None of these texts constitutes a policy, but together they supply a criterion that the figures cannot provide, namely whether the burden of a project falls upon those who did not choose it and will not share in its benefits. That criterion is not exclusive to Catholic social thought. Elinor Ostrom showed that shared basins and aquifers, among them the irrigation huertas of Valencia and Murcia, can be governed durably when those who depend on them take part in setting the rules.[55]
Ultimately, the consolidation of a strategic position in this field will depend on the capacity of states to measure before authorising, to state their conditions before signing, and to give priority to people over servers when a basin runs short, integrating energy policy, water governance and the common good within a single framework of legitimacy. The humanist question is not how much artificial intelligence consumes. It is who decides, with what information, and for whose benefit.
[1] The comparison is an analytical reading of this author. It draws on economic historians who treat artificial intelligence as a possible general-purpose technology, comparable to steam and electricity, whose effects arrive with long delays. See Nicholas Crafts, ‘Artificial Intelligence as a General-Purpose Technology: An Historical Perspective’ (2021) 37(3) Oxford Review of Economic Policy 521 https://doi.org/10.1093/oxrep/grab012 accessed 16 October 2026.
[2] International Energy Agency (IEA), ‘Energy and AI: Executive Summary’ (April 2025) https://www.iea.org/reports/energy-and-ai/executive-summary accessed 7 October 2026.
[3] ‘Data centres account for almost one quarter of Irish electricity usage in 2025’ The Irish Times (7 July 2026) https://www.irishtimes.com/business/2026/07/07/data-centres-account-for-almost-one-quarter-of-irish-electricity-usage-in-2025/ accessed 7 October 2026.
[4] IEA, ‘Key Questions on Energy and AI: Executive Summary’ (16 April 2026) https://www.iea.org/reports/key-questions-on-energy-and-ai/executive-summary accessed 7 October 2026.
[5] IEA 4E, ‘Electric Motor Systems Policy Brief’ (December 2025) https://www.iea-4e.org/wp-content/uploads/2025/12/4E-Policy-Brief-EMSA-9-20251218.pdf accessed 7 October 2026. IEA, The Future of Cooling (2018) https://www.iea.org/reports/the-future-of-cooling accessed 7 October 2026. The cooling figure is eight years old and the two categories overlap, so they cannot be added together.
[6] Gartner, ‘Gartner Says Data Center Electricity Demand Will Grow 26% in 2026’ (press release, 10 June 2026) https://www.gartner.com/en/newsroom/press-releases/2026-06-10-gartner-says-data-center-electricity-demand-to-grow-26-percent-in-2026accessed 7 October 2026. The percentage divides Gartner’s 95 TWh by the 31,779 TWh of world demand measured by Ember, so it is a derived estimate and not a published figure.
[7] Cooper Elsworth and others, ‘Measuring the Environmental Impact of Delivering AI at Google Scale’ (Google, August 2025) https://arxiv.org/abs/2508.15734 accessed 16 October 2026. Epoch AI, ‘How Much Energy Does ChatGPT Use?’ (7 February 2025) https://epoch.ai/gradient-updates/how-much-energy-does-chatgpt-use accessed 7 October 2026.
[8] Elsworth and others (n 7) s 3.1. Sam Altman, ‘The Gentle Singularity’ (10 June 2025) https://blog.samaltman.com/the-gentle-singularityaccessed 16 October 2026.
[9] Mistral AI, ‘Our Contribution to a Global Environmental Standard for AI’ (22 July 2025) https://mistral.ai/news/our-contribution-to-a-global-environmental-standard-for-ai accessed 16 October 2026. The study was carried out with Carbone 4 and the French agency ADEME and reviewed by two consultancies.
[10] IEA, Global EV Outlook 2026 https://www.iea.org/reports/global-ev-outlook-2026/outlook-for-electric-mobility-chap-9-11 accessed 7 October 2026.
[11] IEA, ‘Data Centre Electricity Use Surged in 2025’ (news release, April 2026) https://www.iea.org/news/data-centre-electricity-use-surged-in-2025-even-with-tightening-bottlenecks-driving-a-scramble-for-solutions accessed 7 October 2026.
[12] IEA, ‘Electricity 2026: Executive Summary’ https://www.iea.org/reports/electricity-2026/executive-summary accessed 7 October 2026.
[13] Google, 2026 Environmental Report https://sustainability.google/google-2026-environmental-report/ accessed 7 October 2026.
[14] Alexandra Sasha Luccioni, Emma Strubell and Kate Crawford, ‘From Efficiency Gains to Rebound Effects: The Problem of Jevons’ Paradox in AI’s Polarized Environmental Debate’ (FAccT 2025) https://arxiv.org/abs/2501.16548 accessed 7 October 2026.
[15] Central Statistics Office, ‘Data Centres Metered Electricity Consumption 2024: Key Findings’ https://www.cso.ie/en/releasesandpublications/ep/p-dcmec/datacentresmeteredelectricityconsumption2024/keyfindings accessed 7 October 2026.
[16] EPRINC, ‘Virginia Electricity Demand Growth: The Case of Data Centers’ (2024) https://eprinc.org/virginia-electricity-demand-growth-the-case-of-data-centers/ accessed 7 October 2026.
[17] Hessenschau, ‘Hessen in Karten: Rechenzentrums-Hotspot ohne Limit’ (2025) https://www.hessenschau.de/wirtschaft/hessen-in-karten-rechenzentrums-hotspot-ohne-limit--v1,80-jahre-hessen-rechenzentren-100.html accessed 7 October 2026. AlgorithmWatch, ‘Germany’s Data Center Boom’ (2025) https://algorithmwatch.org/en/germany-data-center-boom/ accessed 7 October 2026.
[18] ‘La desarticulación de Aragón: escasa población en el 84,7% del territorio, con 12,5 habitantes por kilómetro cuadrado’ elDiario.es (21 February 2021) https://www.eldiario.es/aragon/sociedad/desarticulacion-aragon-escasa-poblacion-84-7-territorio-12-5-habitantes-kilometro-cuadrado_1_7238764.html accessed 16 October 2026. The figure is based on census data.
[19] ‘Aragón genera el doble de energía de la que consume’ elDiario.es (2025) https://www.eldiario.es/aragon/economia/aragon-genera-doble-energia-consume-red-saturada-amenaza-ejecucion-inversiones-anunciadas_1_13075972.html accessed 7 October 2026.
[20] Utility Dive, ‘Data Centers Drove Capacity Costs in PJM Auctions’ (January 2026) https://www.utilitydive.com/news/data-centers-pjm-capacity-auction/808951/ accessed 7 October 2026.
[21] Congressional Research Service, report R48646 (updated May 2026), citing Lawrence Berkeley National Laboratory https://www.everycrsreport.com/changes/2026-01-23_R48646_4b7f18147100acc5b29073cf3649df84fd5a08f5__2026-05-12_R48646_db8a48e54b6c090ddcb06a98be9291369c834766.html accessed 7 October 2026.
[22] ‘Texas Grid Sees 233 GW of Data Center Requests, but How Much Is Real?’ BIC Magazine (2026) https://www.bicmagazine.com/industry/powergen/texas-grid-sees-233-gw-data-center-requests-much-real/ accessed 7 October 2026.
[23] Lawrence Berkeley National Laboratory, 2024 United States Data Center Energy Usage Reporthttps://climate.mit.edu/sites/default/files/2025-02/lbnl-2024-united-states-data-center-energy-usage-report.pdf accessed 7 October 2026.
[24] Pengfei Li, Jianyi Yang, Mohammad A Islam and Shaolei Ren, ‘Making AI Less “Thirsty”’ (2023) https://arxiv.org/html/2304.03271v5accessed 7 October 2026.
[25] The Next Web, ‘O’Leary, Data Centers, Water and Golf Courses’ (2026) https://thenextweb.com/news/oleary-data-centers-water-golf-courses-comparison accessed 7 October 2026. These limits are an inference of this author from that article and from the sources cited in this section.
[26] ‘Chile revoca parcialmente los permisos al nuevo centro de datos de Google’ DatacenterDynamics (29 February 2024) https://www.datacenterdynamics.com/es/noticias/chile-revoca-parcialmente-los-permisos-al-nuevo-centro-de-datos-de-google-por-preocupaciones-sobre-uso-de-agua accessed 7 October 2026.
[27] ‘Tucson City Council Rejects Project Blue amid Intense Community Pressure’ AZ Luminaria (6 August 2025) https://azluminaria.org/2025/08/06/tucson-city-council-rejects-project-blue-amid-intense-community-pressure/ accessed 7 October 2026.
[28] ‘El TSJA admite una demanda contra los centros de datos de AWS en Aragón’ DatacenterDynamics España (2026) https://www.datacenterdynamics.com/es/noticias/tsja-admite-demanda-contra-data-centers-de-aws-en-arag%C3%B3n/ accessed 7 October 2026.
[29] ‘Georgia Families Sue Meta, Accuse Its Data Center of Tainting Their Water’ Atlanta Journal-Constitution (September 2026) https://www.ajc.com/news/2026/09/georgia-families-sue-meta-accuse-its-data-center-of-tainting-their-water/ accessed 7 October 2026.
[30] ‘Meta’s Zeewolde Data Centre Plan’ Silicon Republic (2022) https://siliconrepublic.com/enterprise/meta-facebook-data-centres-netherlands-zeewolde accessed 7 October 2026.
[31] ‘Thirsty for Data: Water Scarcity Challenges Gulf’s AI Ambitions’ AGBI (May 2025) https://www.agbi.com/analysis/ai/2025/05/thirsty-for-data-water-scarcity-challenges-gulfs-ai-ambitions/ accessed 7 October 2026.
[32] ‘From Oil to AI: UAE’s Stargate Campus Targets 200 MW Online by 2026’ MIT Sloan Management Review Middle East (2026) https://www.mitsloanme.com/article/from-oil-to-ai-uaes-stargate-campus-targets-200-mw-online-by-2026 accessed 7 October 2026. ‘Humain Targets Early 2026 Start for First Data Centre’ AGBI (August 2025) https://www.agbi.com/ai/2025/08/humain-targets-early-2026-start-for-first-data-centre/ accessed 7 October 2026. The status of both sets of targets in October 2026 is not confirmed in the sources consulted.
[33] ‘US Chip Exports to the Middle East’ Foreign Policy (8 May 2025) https://foreignpolicy.com/2025/05/08/us-chip-exports-middle-east-ai-data-centers/ accessed 7 October 2026. The terms of any final agreement and the export control regime in force in October 2026 are not verified here, nor is the energy source of Stargate UAE.
[34] ‘CRU Publishes Long-Awaited Final Policy on Data Centre Connections’ William Fry (December 2025) https://www.williamfry.com/knowledge/cru-publishes-long-awaited-final-policy-on-data-centre-connections/ accessed 7 October 2026. This account rests on a law firm summary and should be checked against the text of the decision.
[35] ‘State Regulation of Data Centers 2026: A Shifting Landscape’ AFS Law (2026) https://www.afslaw.com/perspectives/alerts/state-regulation-data-centers-2026-shifting-landscape accessed 7 October 2026.
[36] Shawn Donnan, Estelle Ou and Jorgelina Do Rosario, ‘How the AI Boom Is Fueling Global Financial Risks’ Bloomberg (12 October 2026) https://www.bloomberg.com/news/features/2026-10-12/how-the-ai-boom-is-fueling-global-financial-risks accessed 13 October 2026. The figures are attributed in the article to county officials and were not checked against the county budget.
[37] ibid.
[38] ‘European Commission Advances Data Center Sustainability Ratings’ Beveridge & Diamond (2026) https://www.bdlaw.com/publications/european-commission-advances-data-center-sustainability-ratings-and-consults-on-minimum-performance-standards/ accessed 7 October 2026. Regulation (EU) 2024/1689, Annex XI.
[39] Ministerio para la Transición Ecológica y el Reto Demográfico, ‘El Gobierno plantea impulsar los centros de datos sostenibles’ (August 2026) https://www.miteco.gob.es/es/prensa/ultimas-noticias/2026/agosto/-el-gobierno-plantea-impulsar-los-centros-de-datos-sostenibles--.htmlaccessed 7 October 2026. Its content following the consultation and its current status are not verified here.
[40] ‘El crecimiento desordenado de centros de datos’ Energías Renovables (11 September 2026) https://www.energias-renovables.com/panorama/el-crecimiento-desordenado-de-centros-de-datos-20260911 accessed 7 October 2026. The figures are attributed to the ministry and were not verified against the official statement.
[41] ‘Incertidumbre en conexiones de data centers’ DatacenterDynamics (2026) https://www.datacenterdynamics.com/es/noticias/incertidumbre-en-conexiones-de-data-centers-cnmc-pospone-mapas-de-capacidad-de-ree-hasta-mayo-2026/ accessed 7 October 2026.
[42] ‘Brasil: 38 GW de data centers’ Canal Solar (July 2026) https://canalsolar.com.br/brasil-trinta-e-oito-gw-data-centers-silveira/ accessed 7 October 2026.
[43] ‘Data centers en Querétaro chocan con el estrés hídrico’ Expansión (27 May 2026) https://expansion.mx/tecnologia/2026/05/27/data-centers-en-queretaro-chocan-con-el-estres-hidrico accessed 7 October 2026.
[44] ‘Inteligencia artificial: conflictos por centros de datos, agua, energía y territorio’ Mongabay Latam (March 2026) https://es.mongabay.com/2026/03/inteligencia-artificial-conflictos-centros-de-datos-agua-energia-territorio/ accessed 7 October 2026.
[45] Epoch AI, ‘Data Centers’ https://epoch.ai/data/data-centers accessed 7 October 2026. The database reports power estimates accurate within a factor of 1.4 at 80 per cent confidence, and is published under a Creative Commons licence.
[46] Federation of American Scientists, ‘Tracking Hyperscale AI Data Center Growth with Satellite Imagery’ https://fas.org/publication/tracking-hyperscale/ accessed 7 October 2026.
[47] IEA (n 2).
[48] UN Committee on Economic, Social and Cultural Rights, General Comment No 15: The Right to Water (2002) para 6 https://documents.un.org/doc/undoc/gen/g03/402/32/pdf/g0340232.pdf accessed 7 October 2026. See also UNGA Res 64/292 (28 July 2010). The application of these texts to a dispute between a data centre and household use is an inference of this author and not a finding of any United Nations body.
[49] Emma Strubell, Ananya Ganesh and Andrew McCallum, ‘Energy and Policy Considerations for Deep Learning in NLP’ (2019) https://arxiv.org/abs/1906.02243 accessed 7 October 2026. Jai Vipra and Sarah Myers West, ‘Computational Power and AI’ (AI Now Institute, 2023) https://ainowinstitute.org/publications/compute-and-ai accessed 7 October 2026.
[50] ‘How Water Scarcity Threatens Taiwan’s Semiconductor Industry’ The Diplomat (September 2024) https://thediplomat.com/2024/09/how-water-scarcity-threatens-taiwans-semiconductor-industry/ accessed 16 October 2026.
[51] Directive (EU) 2023/1791 of the European Parliament and of the Council on energy efficiency [2023] OJ L231/1, art 26(6) and (7).
[52] Dicastery for the Doctrine of the Faith and Dicastery for Culture and Education, Antiqua et Nova: Note on the Relationship Between Artificial Intelligence and Human Intelligence (28 January 2025) paras 53 and 96 https://www.vatican.va/roman_curia/congregations/cfaith/documents/rc_ddf_doc_20250128_antiqua-et-nova_en.html accessed 16 October 2026.
[53] Pope Francis, Laudato si’ (24 May 2015) paras 30 and 51 https://www.vatican.va/content/francesco/en/encyclicals/documents/papa-francesco_20150524_enciclica-laudato-si.html accessed 16 October 2026.
[54] Pope Leo XIV, Magnifica humanitas: Encyclical Letter on Safeguarding the Human Person in the Time of Artificial Intelligence (15 May 2026) paras 72, 83 and 101 https://www.vatican.va/content/leo-xiv/en/encyclicals/documents/20260515-magnifica-humanitas.html accessed 16 October 2026.
[55] Elinor Ostrom, Governing the Commons: The Evolution of Institutions for Collective Action (Cambridge University Press 1990) chs 3 and 4.